

Every country that raises livestock is making decisions that affect its food supply. Knowing how many animals exist, where they are, and whether they are healthy should be straightforward.
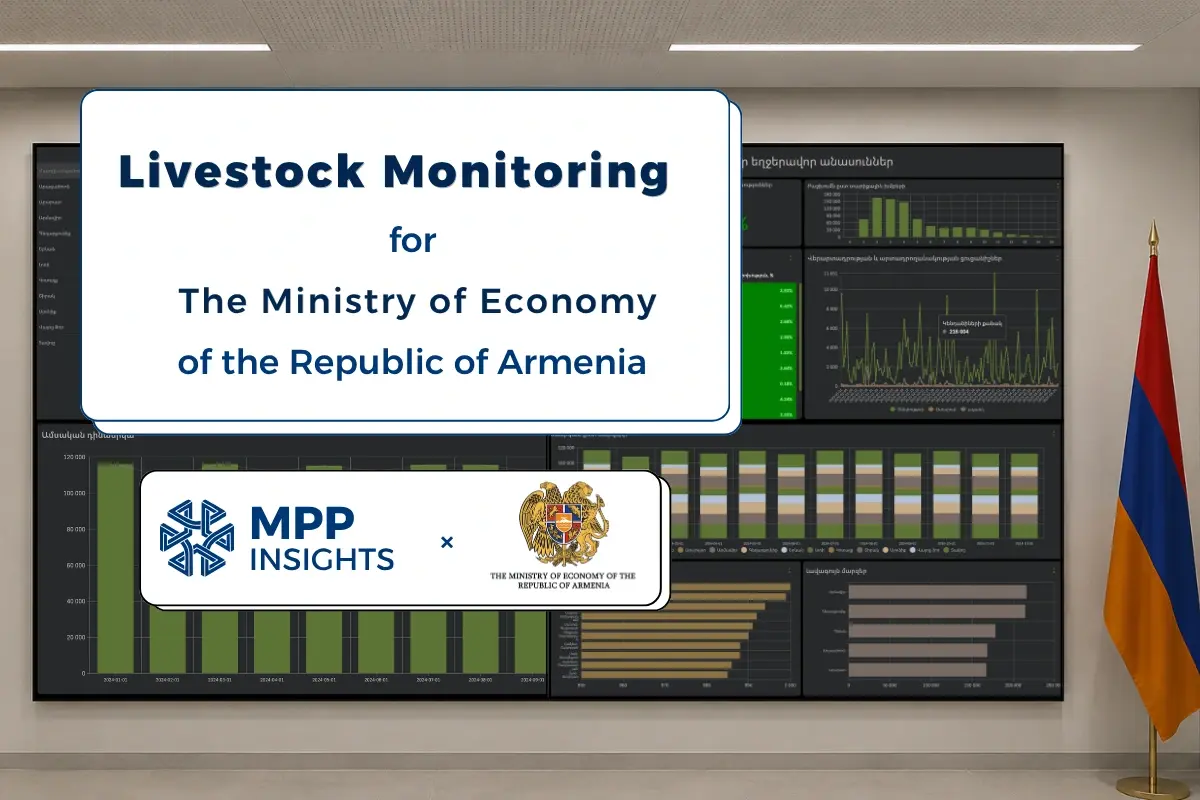
MPP Insights partnered with Avromic to build a country-wide livestock reporting and analytics solution for Armenia's Ministry of Economy, using MPP BI, our flagship business intelligence platform.
The Ministry of Economy was using an outdated livestock management system called AniPas. The system wasn’t fit for purpose and the information wasn’t easy to use for decision making.
In this project walkthrough, we'll look at the challenges and the solution that we built, and how MPP BI helped the Ministry see their livestock data clearly and act on it.
Why Real-Time Visibility Matters in National Agriculture
Before going into the project specifically, it’s imperative to understand why visibility in national agriculture matters and why data needs to be easy to use for the policymakers.
Livestock data is often spread across different regions and systems. If someone in the Ministry wants a national view, they have to pull reports, compare numbers, and combine information from multiple sources. This typically requires asking someone else to pull a report (and therefore adding extra steps) and makes it harder to spot issues early as this creates an artificial barrier for information flow to decision makers.
Here’s some examples of issues with real-time needs:
- Vaccination coverage. If animals in one region are not vaccinated on time, disease can spread beyond that region. If the data is not visible early, small issues can grow into bigger problems.
- Population trends. A drop in births or a rise in slaughter can signal a problem that needs attention.
- Regional comparisons. Some regions may perform better than others. Without a clear view of the data, these differences can be difficult to spot.
How MPP Insights Built the Livestock Monitoring System
Our team at MPP Insights integrated MPP BI into the system as the analytics and reporting layer. MPP BI is a modern business intelligence platform built for analytics, reporting, and data visualization. If you want to learn more about BI, we explained it simply in our “What is Business Intelligence” blog.
We designed multiple customized dashboards based on the key performance indicators (KPIs) the Ministry of Economy needed to monitor - with the flexibility of being able to drill-down further into the specific trends.
The Avromic team upgraded the core systems at the Ministry to support the actual data collection and structures needed. They built the mobile application as part of the solution.

To learn more about how it works and how it compares to other BI tools, visit the MPP BI product website.
Live Livestock Dashboards on Wall-Mounted Screens
The dashboards currently run on large screens mounted on the walls of the Ministry (much like a Houston Space Center or Command Center) and on staff computers. They rotated between views automatically, so staff had a live overview without having to click through anything.
The views covered:
- Animal numbers across the country and by region
- Separate tracking for cattle, sheep, and goats
- Vaccination status and coverage
- Birth and slaughter numbers
- Regional comparisons
A Closer Look at the Dashboards
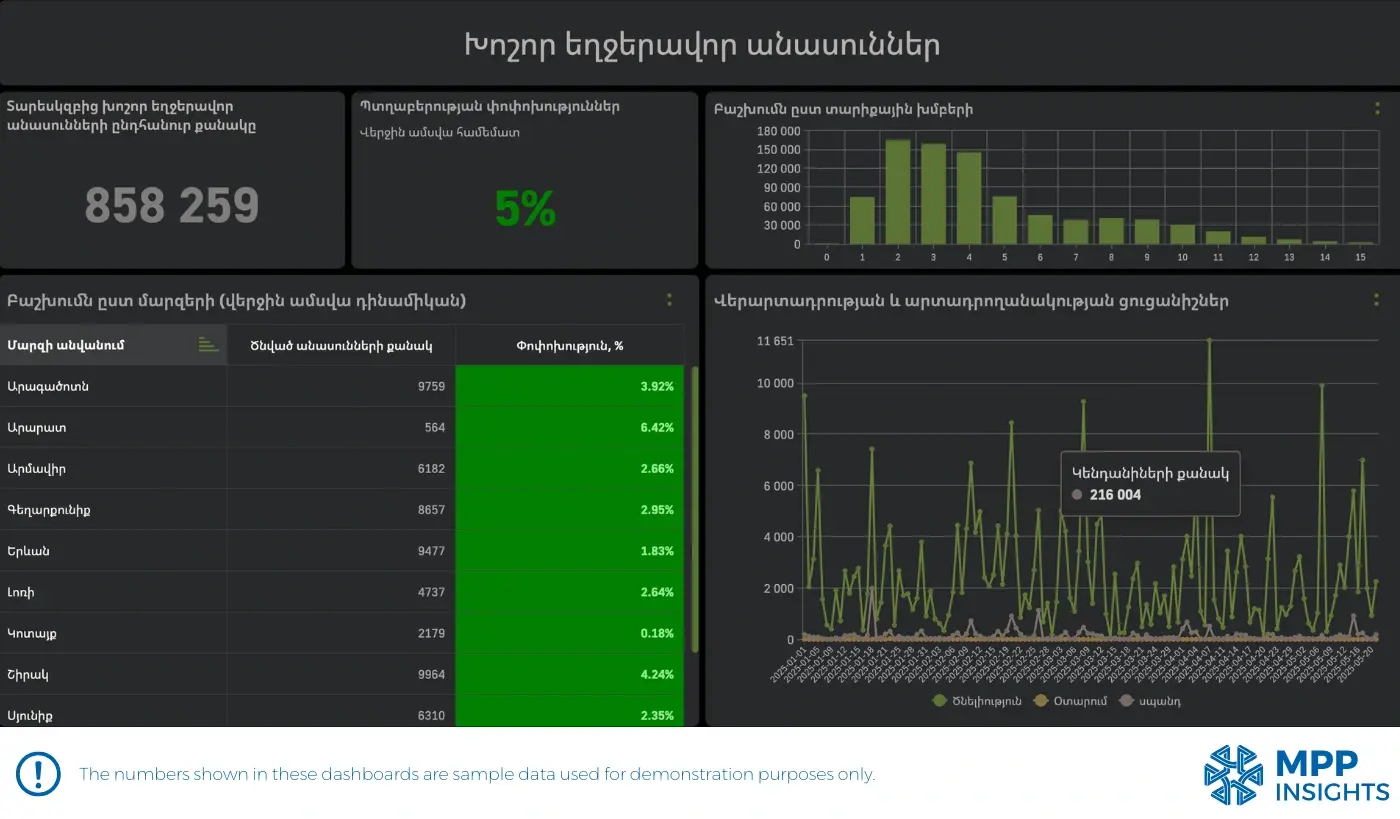
The screenshots below show the dashboards as they were built. The numbers visible in them are sample data used for demonstration. The Ministry's actual livestock records are confidential.
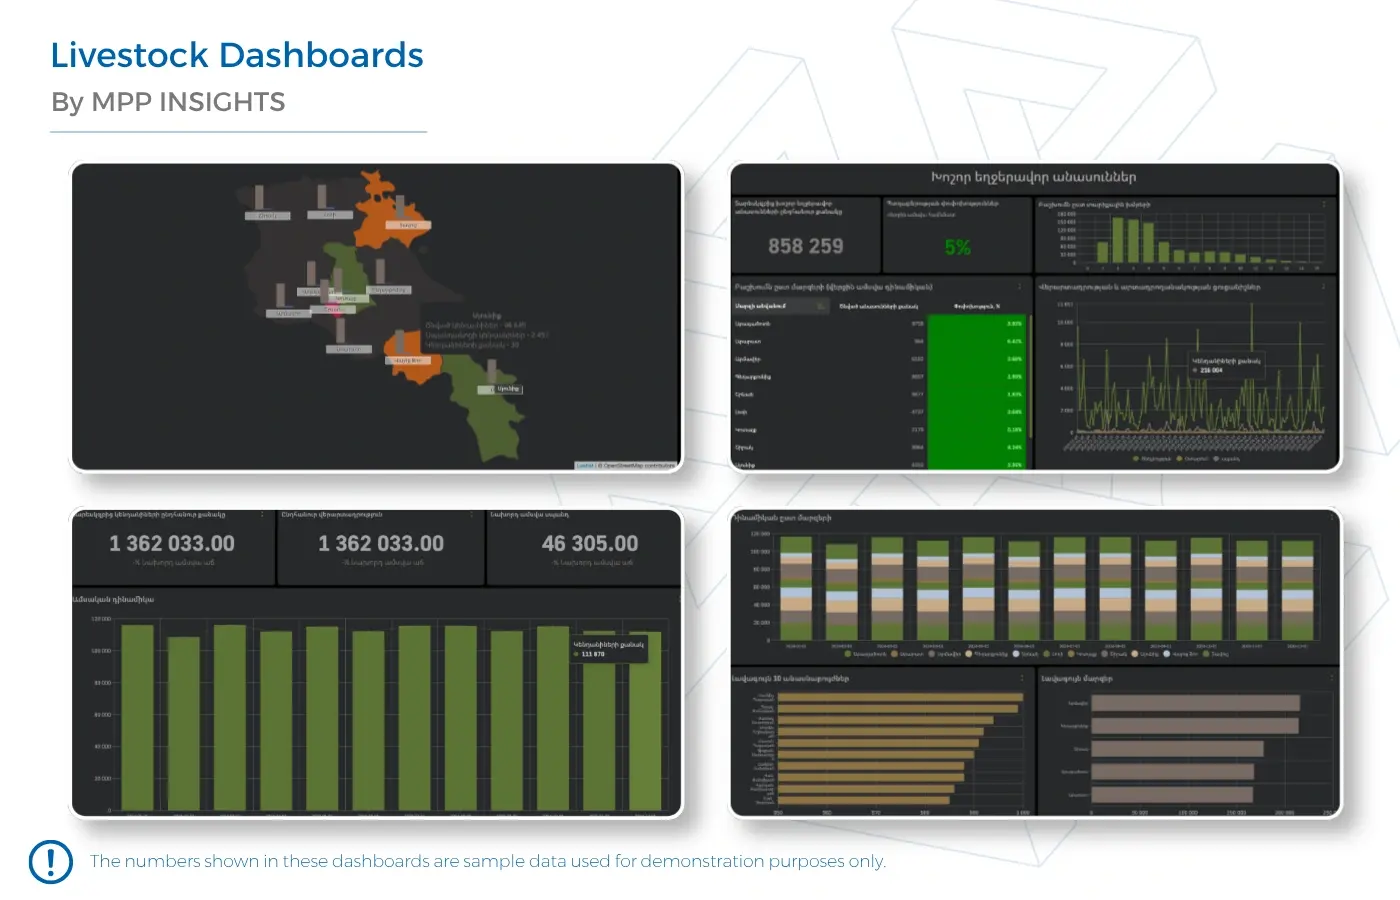
Here is what each dashboard covers.
Overview
The main dashboard gives a national summary in one view.
At the top, it shows three key numbers:
- Total animal count for the year
- Total births
- Slaughter from the previous month
Below that, the bar chart shows how the total population changed month by month during the year.
Regional Map
This view shows a map of Armenia with all regions.
Each region shows its animal count. You can click a region to see a short summary of its main numbers.
This makes it easy to compare regions geographically and see differences across the country.
Regions Table
This dashboard lists all regions in a table.
For each region, it shows:
- Total animal count
- Births
- Slaughter
- Change compared to the previous month
Regions with a drop are marked in red so they are easy to spot.
Veterinarians
This dashboard tracks the people responsible for animal care.
It shows monthly activity by region, a list of the top 10 most active veterinarians, and the best-performing regions.
This allows the Ministry to see how the care network is working and invest resources into underperforming areas. It could also contribute to data-sharing with local NGOs that support farmers and cattle ranchers.
Cattle, Sheep, and Goats
Each animal type has its own dashboard. The cattle dashboard shows total numbers, fertility rates, and the age structure of the herd. It also shows births, calves, and slaughter over time, plus a regional breakdown.
Similar dashboards were built for sheep and goats, using the same structure. This gives a clear view of each animal type on its own, not only the combined total.
How the Solution Changed the Ministry's Work
- Staff can see the full national picture across all regions without pulling a single report.
- Vaccination gaps are visible early, before they grow into a larger problem.
- All regions can be compared at the same time on one screen.
- Animal health trends are tracked over time.
- Veterinarian activity is ranked by region, so the Ministry knows where animals are being looked after and where attention is needed.
- The information is always on the screen and there is no need to consider requests.
About MPP BI
MPP BI is the platform behind the dashboards in this project. It handles analytics, reporting, and visualization, and can be built around what an organization actually needs.
What makes MPP BI different from legacy BI tools is its data-centric architecture. Most BI tools copy data from the database into a separate engine before they can display it. With data-centric architecture, data stays where it is, which reduces latency and minimizes network traffic, because the data doesn’t have to be fetched from a data center.
For this project, that mattered. The Ministry needed a live view of the whole country, and MPP BI made that possible.
A Final Note
This project is a strong example of what the right data infrastructure can do when it is built around specific needs. The Ministry of Economy and Republic of Armenia doesn’t need generic reporting tools - they really need data to transform into insights, and delivered in a timely manner to their policy-makers, operations teams, and stakeholders.
MPP Insights is built on the foundation of experts who continually sharpen their skillsets with projects like this. We believe data should be used for the public good, and this project is exactly one of those examples.
This growing partnership with the Ministry of Economy in Armenia is especially close to our team, as MPP Insights was started in Armenia and our R&D Center is based in Yerevan. We built innovation that will impact us.
If you work for a government agency and would like to request more information on this project showcase, please contact our team at welcome@mpp-insights.com.