
Numbers do magic in a business, only if you’re able to understand them. Companies have tons of numbers from sales, customer info, website visits, inventory, and much more. This raw data is meaningless unless it’s cleaned, organized, and finally, visualized!
Business Intelligence (BI) at its core is about visualizing data in a way that humans can understand the impact and make informed decisions. Its name is simply - business intelligence, for a reason.
This article is an introduction to Business Intelligence and why it matters for your business.
Our team believes that data can either save you money or make more money - or in more business jargon, creating shareholder value is done through optimizing businesses or adding revenue streams. The benefits of having real business intelligence are game-changing. Unfortunately most businesses struggle even though they have access to the best tools for business intelligence because they either don’t have time, they aren’t technical, or they don’t believe there is an ROI in BI.
Because we love coffee, and I’m sure you do too, we’ll use a vivid example of implementing BI in a coffee shop so you can understand how it works step by step. We’ll also share one of our healthcare cases in more detail. There are many more cases, and you can explore them as well.
What Is Business Intelligence (BI) In Simple Terms
BI is basically the process of taking all the data a company has and turning it into information that helps people make better decisions. Every day, you create millions of data points by simply living and going about your day, but turning that data into information is the journey of data engineering.
In a coffee shop, they record every sale, what drink was bought, at what time, and by whom. BI can take all this info and show:
- Which drinks sell the most
- What time of day is busiest
With this information, the owner can decide to make more of the popular drinks during peak hours.
In simple terms, we answer the question 'What is Business Intelligence?' briefly: it's all about turning confusing numbers into useful insights.
How Business Intelligence Works
BI works in a few simple steps, even though behind the scenes it can get technical. We’ll keep it very simple:
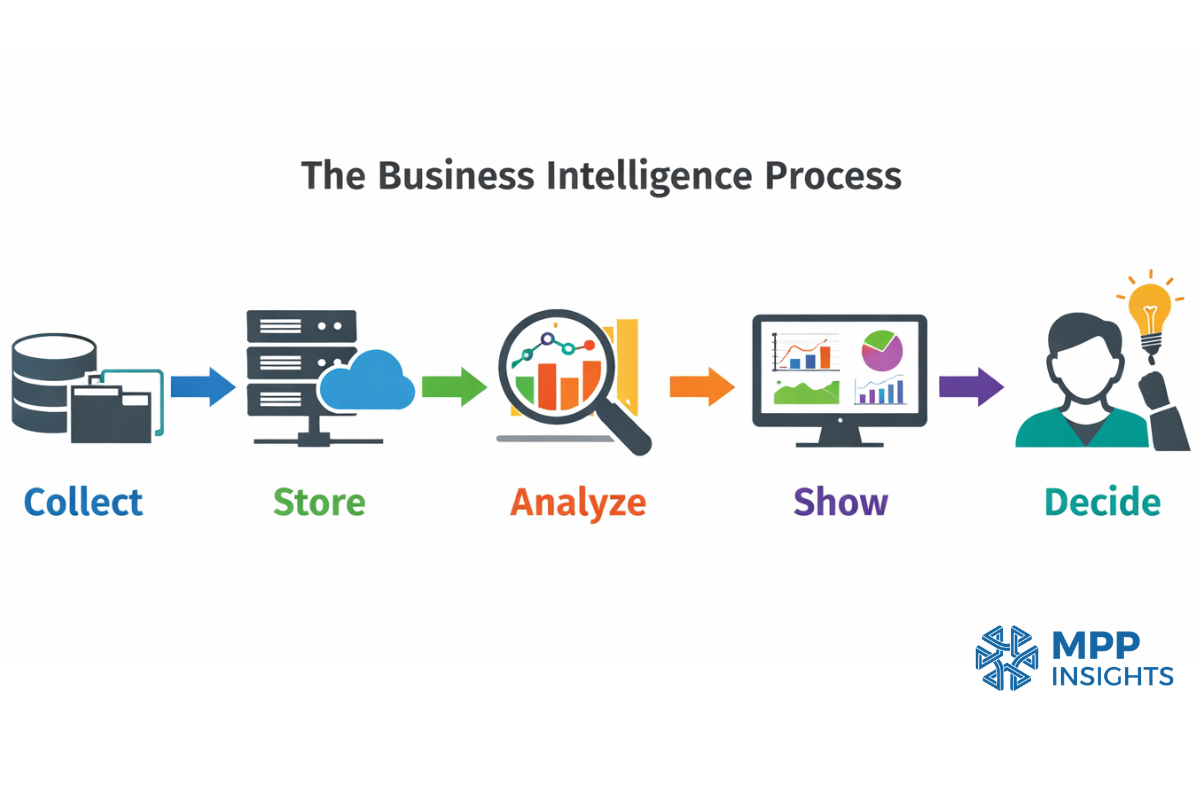
Collecting Data
First, a company gathers data from all sorts of places. At this stage the data is scattered in multiple places.
The coffee shop collects sales from the cash register, website orders, customer feedback forms, and inventory records. If the coffee shop has several branches, each branch also produces its own data every day.
Moving and Preparing Data (ETL)
Before the data can be analyzed, it usually needs to be organized. This process is called ETL, which stands for Extract, Transform, and Load.
In simple terms, it means taking data from different systems, cleaning it, and putting it in one place so it can be used.
The coffee shop has sales data in the cash register and on the website. ETL collects this data, organizes it, and prepares it for analysis.
Storing Data
After the data is prepared, it is stored in a database or a data warehouse. All this data needs to be in one place so it can be used and analyzed. This system can be on a company server, which is called on-premise, or in the cloud.
Processing and Analyzing Data
Now the clean and organized data is ready to be processed and analyzed. At this stage, the user chooses what they want to explore by combining or comparing data, such as filters, time ranges, products, locations, and more. So the BI system doesn’t give fixed answers. The owner asks questions to the data.
By combining different pieces of data, the user can start to see patterns and make better decisions.
The coffee shop owner might look at sales by drink, by time of day, or by season. The system might show that iced coffee sells more in summer, or that muffins sell more on weekends.
Presenting Insights
The results are shown in a simple way using dashboards, graphs, or reports. These visuals help people understand the data quickly.
The coffee shop can see on the dashboard which drink sells best each day, without having to count everything manually. If they want more details, they can filter the dashboard by week, month, or by a specific branch.
Making Decisions
Now that every insight is in front of you, it’s time to take action. The patterns and trends help users make better and faster decisions. This can improve sales and customer satisfaction. Sometimes, putting time and money into the wrong product or approach can cost a lot with little return.
The coffee shop might start a weekend muffin special because the dashboard shows muffins sell more on weekends. They might also stock extra iced coffee in summer when sales are highest.
How BI analyzes data to find patterns
What you see behind those colorful dashboards is thousands of numbers that are turned into clear answers. To do this, BI performs a few actions on the data. When the data is combined, patterns start to appear.
Counting: The system counts how many times something happened. (Example. How many lattes were sold today)
Adding and totaling: The system adds numbers together to show totals. (Example. Total revenue from iced coffee)
Grouping data: The system groups data into categories. (Example. Sales by drink type)
Comparing data: The system compares numbers to see differences. (Example. Morning sales vs afternoon sales)
Finding trends and forecasting: The system looks at how numbers change over days, months, or seasons to identify patterns. It can also predict what might happen next using trend analysis and forecasting. (Example: Iced coffee sales increase in summer, so the system can help anticipate future demand.)
How BI Presents Insights
After the data is analyzed, the results need to be easy to read. If people cannot understand the results quickly, the analysis isn’t very useful.
At this stage, the BI process is complete. Data is collected, stored, analyzed, shown in dashboards or reports, and then used to make decisions.
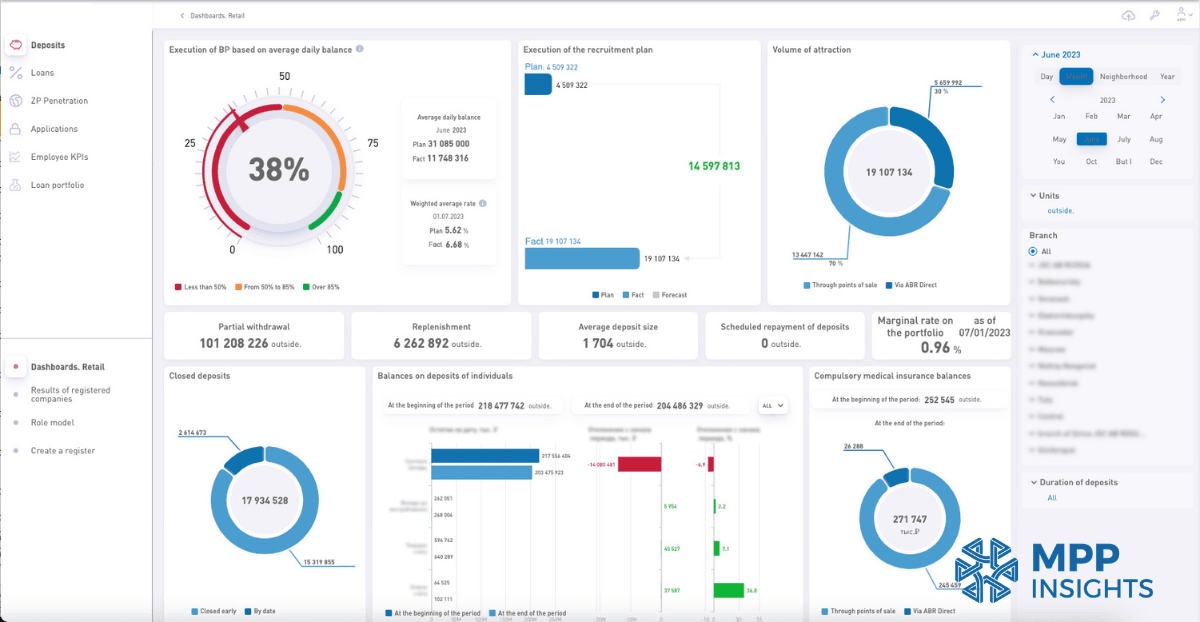
Dashboards in BI
A dashboard is a visual screen that shows the most important information in one place. It usually includes charts, graphs, and simple numbers.
BI dashboards are interactive. Users can filter data, change time ranges, or focus on specific products or locations. Modern BI tools like MPP BI are easy to use, so even non-technical users can work with them.

Today, BI is not just about dashboards anymore. AI models are becoming part of the workflow and helping users explore data in new ways. We wrote more about this in our experiment on Testing NVIDIA Nemotron 3 Super in MPP BI .
Reports in BI
A report gives more detailed information. It helps users explore the numbers more closely. The coffee shop report might show sales by day and by drink type.
One BI tool people often use is IBM Cognos. We’ve compared it with MPP BI, a modern and more affordable Cognos alternative. Check out our full comparison to see how MPP BI dashboards and reporting can be customized to fit your business needs.
How Business Intelligence Is Changing in 2026
For years, teams used BI to built dashboards, looked at charts and reports, and then decided what the data meant and what actions to take. People were responsible for the analysis and decision-making.
Now, a new approach called agentic BI is changing that process. AI agents can gather data, build dashboards, analyze results, and identify important changes, all with much less manual work.
The difference is easy to understand. Traditional BI shows you what happened, while agentic BI helps you understand why it happened and what to do next.
If you want to learn more, check out our guide on how agentic BI works and get a clear understanding of the differences between traditional BI and agentic BI architecture.
Benefits of Business Intelligence
BI helps businesses understand what is working, what is not working, and what they should do next. Here are some simple benefits to find out the importance of business intelligence:
Better decisions
BI turns numbers into clear information. This helps people make decisions based on facts, and not guesses.
Saves time
Without BI, people often search through spreadsheets or count numbers manually. BI shows the information quickly in one place.
Instead of checking hundreds of receipts, the owner opens the dashboard and immediately sees total sales for the day.
Spot trends and opportunities
BI helps businesses notice patterns over time. The dashboard shows that iced coffee sales increase every summer. The shop can prepare promotions and stock more ingredients before the season starts.
Identify problems early
BI can also show when something is going wrong. When customer feedback shows slower service on weekends, the owner can schedule more staff during busy hours.
Improve profit
When a business clearly sees what sells well and what doesn’t, it can focus on the right products.
Data engineering companies like us can use BI to build solutions for different industries. For example, we have call analytics for call centers. This solution analyzes customer conversations and presents the data in dashboards to help teams understand customer needs and common problems. Every business that has calls from customers needs BI solutions to understand its customers. Happy customers make a business more successful, and that's the secret to growth.
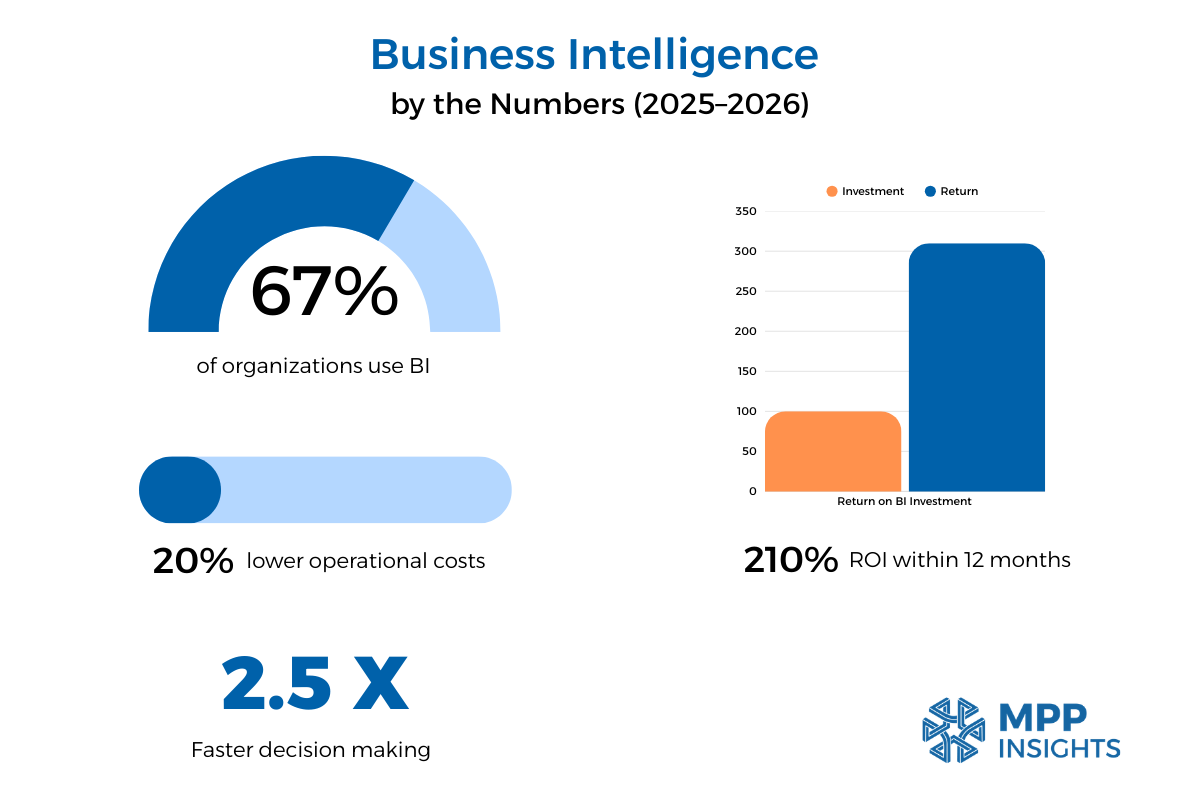
Impressive BI Numbers for 2025–2026
Now that we understand the benefits of BI, let's look at some numbers from sources like Hydrogen BI for 2025–2026. These stats show how BI can really change a business.
Types of Business Intelligence
Descriptive BI – what happened
This type tells you what has already happened using historical data, it shows you the past. It answers questions like which products sold most or which periods were busiest.
Diagnostic BI – why it happened
This type looks at data to understand the reasons behind past results. It helps find patterns, trends, and causes so you know why something happened.
Predictive BI – what might happen
This type uses past data and trends to forecast future outcomes. It helps you see what’s likely to happen next so you can plan ahead.
Prescriptive BI – what to do next
Prescriptive BI recommends actions based on data and predictions. It shows the best steps to take to achieve your goals or avoid problems.
BI might suggest adding a weekend muffin promotion because historical data shows that promotions increase sales by 20%.
We’d love to hear about your business and what matters most to you. We can walk you through dashboards and reports made for your needs and show how data can make decisions easier and faster.
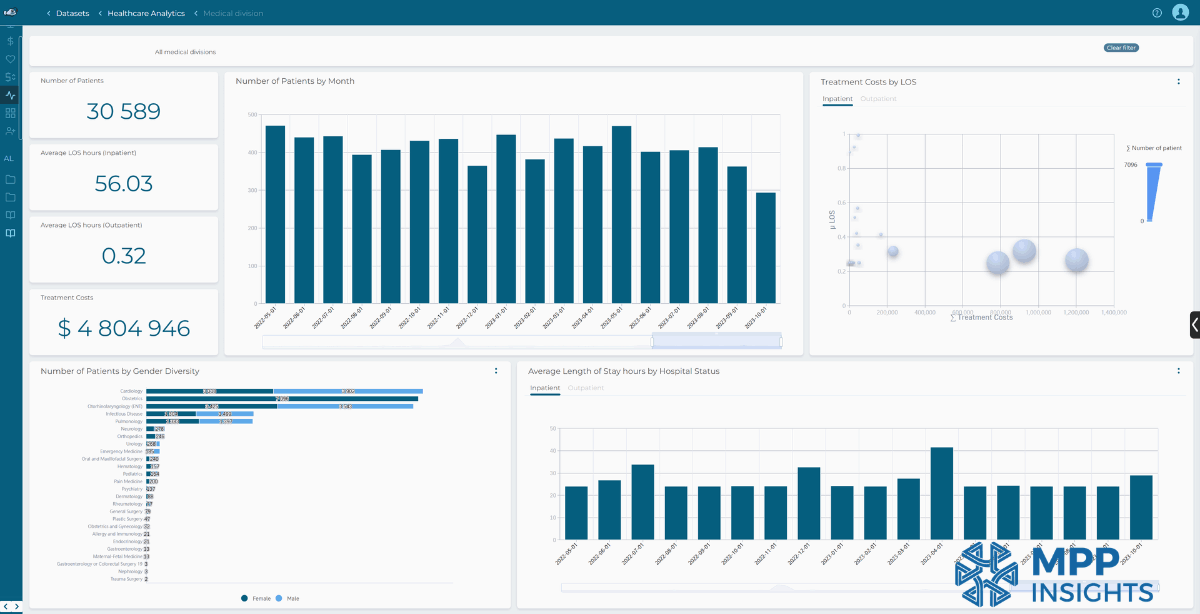
Healthcare BI Case Study
To make BI easier to understand, we used the coffee shop example throughout the article. Now we’ll share a real case from the healthcare industry. We have many more BI case studies in different industries, and you can explore them as well.
Challenge
A healthcare provider had large amounts of data from different systems. Patient records, insurance claims, and hospital departments all produced data every day. But this data was scattered and hard to analyze.
The team could not easily see how many patients they treated, which departments were busiest, or which treatments created the highest costs. It was also difficult to understand patient trends over time or compare inpatient and outpatient activity. As a result, many decisions were based on partial information.
Solution
A BI system was introduced to bring all healthcare data into one place. Data from patient records, insurance systems, and hospital departments was collected and organized.
Dashboards and reports were created so the healthcare team could easily explore the data. They could see how many patients were treated, compare inpatient and outpatient activity, and follow patient trends over time.
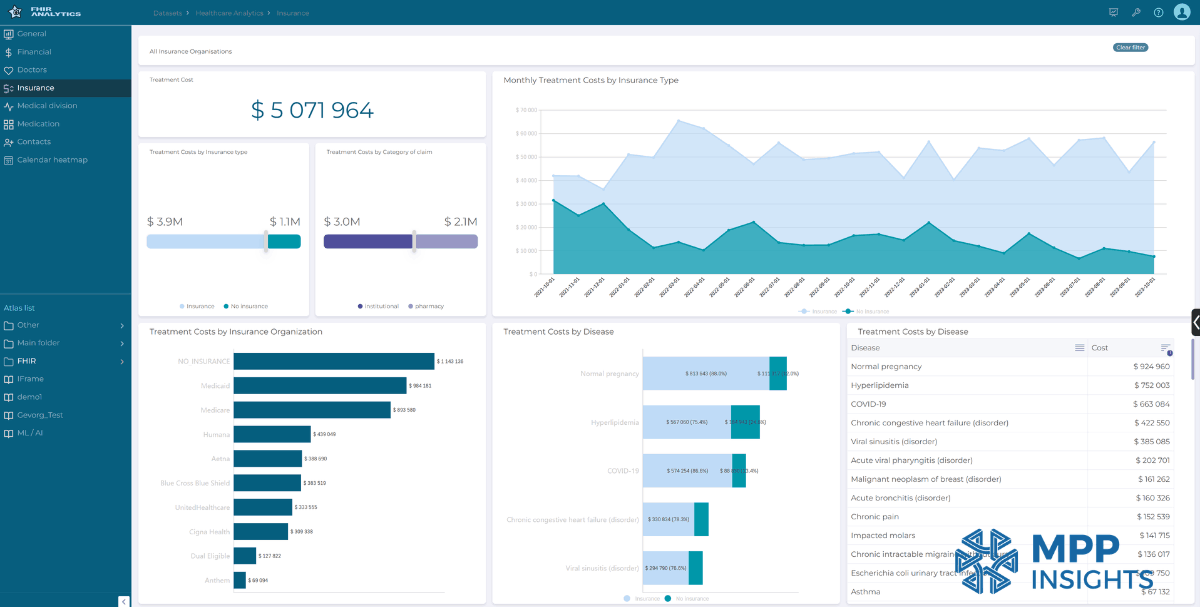
The system also helped the team analyze treatment costs and insurance coverage. Management could see how costs changed by insurance provider, treatment type, or disease.
The BI system also showed operational data, such as where patients were coming from, which medical divisions treated the most patients, and the average length of hospital stays.
Result
With all the data in one place, the healthcare provider could see patterns more clearly. They could track patient activity and understand treatment costs.
The dashboards helped the team see how many patients were treated, compare departments, and follow changes over time. They could also see which diseases created higher costs and how insurance coverage affected total expenses.
With this information, the hospital could make better decisions, adjust resources between departments, and plan their work more effectively. BI helped turn scattered healthcare data into clear and useful information.
How We Help Businesses with BI
Searching for business decision support is a tedious process and most companies don’t know where to start, which tools to try, or who to trust. We’ve met executives who just picked a big company and paid hundreds of thousands of dollars for minimal results.
Plenty of companies in the data consulting industry are only selling a single software solution for a singular problem - rather than assessing and improving the entire data pipeline and prescribing the correct solution. Business Intelligence is only the visualization layer, and if there’s garbage in, there’s garbage out too - despite how nicely designed the dashboards are.
MPP Insights is proud to be the holistic consulting firm that specializes in every aspect of data. Our teams will audit your infrastructure and identify weaknesses or single points of failure so we can confidently build solutions that will improve your business.
MPP Insights is a leading data engineering and AI/ML consulting firm based in Richmond, Virginia, with decades of experience helping firms across all industries. We help companies collect data from different places, organize it, and turn it into dashboards and reports that are easy to read. Each dashboard is customized to show exactly what you want to see. Our solution can run on-premise, integrate with your existing systems, and is more affordable than traditional options.
We start by understanding your goals and challenges, then help find the right solutions and make decisions based on the insights.
Want to see how it works? Schedule a call and we can explore our dashboards and reporting system. You’ll see how simple it is to turn data into decisions.