
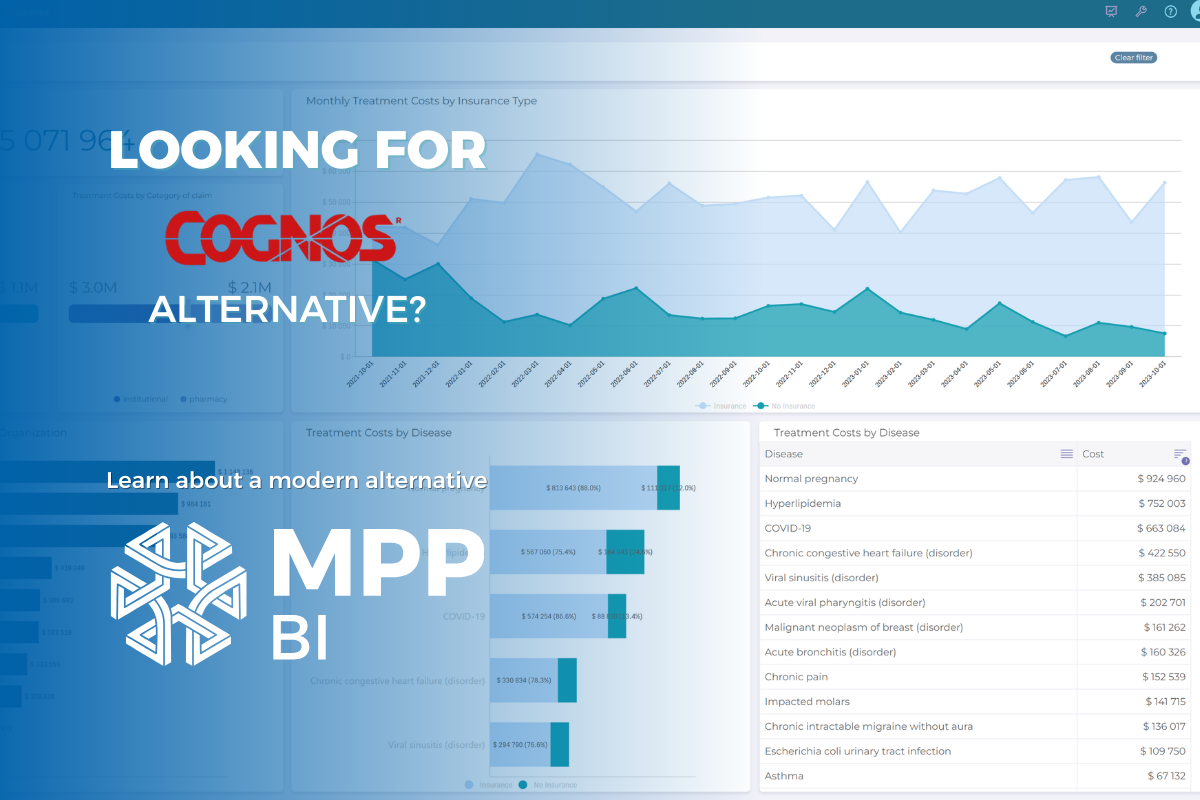
If you're looking for IBM Cognos alternatives, you're likely dealing with one of three issues: high costs, a complicated interface, or outdated technology. Cognos has been around for decades, but many companies are now looking for modern reporting platforms that are faster, more affordable, and easier to use.
This guide compares the top Cognos alternatives in 2026, including cloud-native options, enterprise platforms, and cost-effective solutions. We'll show you what each tool does best, how pricing compares, and where MPP BI fits in as an affordable replacement with both cloud and on-premise deployment.
What is Cognos Reporting and How It Works?
Cognos Reporting is a software tool made by IBM. It pulls data from different sources, organizes it into tables, charts, and dashboards, and lets companies analyze this information to make better decisions. It’s part of a larger package called IBM Cognos Analytics, which is designed for analyzing business data.
Top 5 IBM Cognos Alternatives in 2026
Microsoft Power BI
Best for: Companies already using Microsoft tools like Excel, Azure, or Office 365
Power BI connects easily with Microsoft products and offers strong data visualization. It's widely used and has a large community for support, so you can find answers and tutorials quickly.
However, Power BI is built on legacy BI architecture, which means it copies your data into its own system before you can analyze it. This can cause delays with large datasets and creates dependency on Microsoft's ecosystem. If you're not using Microsoft tools across your business, you may run into limitations or need workarounds. Pricing starts at $10 per user per month for Pro licenses.
Tableau (by Salesforce)
Best for: Advanced data visualization and exploring complex data
Tableau is known for powerful charts and graphs. It's popular in industries like finance and healthcare where teams need to dig deep into data. The interface takes some time to learn, but it's flexible once you get the hang of it.
However, Tableau uses legacy BI architecture with a calculation engine that creates limitations. When you work with Tableau, it either copies your data into its own memory (which means you're not seeing live data) or connects directly to your database but can't run complex calculations (which limits what reports you can build). As your data grows, you'll need more expensive server resources to keep performance fast. Pricing starts around $15 per user per month.
MPP BI (by MPP Insights)
Best for: Companies wanting real-time data, affordable pricing, and no vendor lock-in
MPP BI takes a completely different approach than traditional BI tools. Instead of copying your data or using a calculation engine, it connects directly to your database and runs all calculations where your data already lives. This means you get live results on any amount of data without performance limits or expensive infrastructure.
The platform offers clear pricing ($10/month for read-only users, $18/month for admin users) and works both in the cloud and on-premise. You can also buy a one-time perpetual license instead of paying monthly. It includes AI features for building reports in plain English, and you can customize it with your company's branding.
Qlik Sense
Best for: Self-service analytics where users explore data on their own
Qlik Sense lets users click around and find insights without needing IT to build every report. It's known for its associative engine, which helps users see how different data points relate to each other. This makes exploration feel more intuitive than other tools.
Like other traditional BI platforms, Qlik loads your data into its own system before you can analyze it. This means you're working with a copy of your data, not live information. As your datasets grow, you'll need more hardware and higher-tier licenses to maintain performance. Pricing varies based on how you deploy it.
Looker (by Google)
Best for: Companies using Google Cloud Platform
Looker is built for cloud-first organizations and works well with Google's BigQuery. It uses a modeling language called LookML to define how data connects, which gives technical teams more control but requires coding knowledge to set up and maintain.
Looker also uses a calculation layer between your data and the reports. While it's more modern than Tableau or Power BI, it still creates dependencies on Google's infrastructure and requires ongoing management of the LookML models. If your team isn't technical or you're not already using Google Cloud, there's a learning curve. Pricing is custom based on your usage.
MPP BI: A Closer Look at Our Cognos Alternative
MPP BI MPP BI is a platform that creates reports and dashboards from your business data. It's designed as a modern alternative to legacy tools like Cognos, Tableau, and Power BI, with a focus on affordability, real-time performance, and flexibility.
What Makes MPP BI Different
No Calculation Engine, No Data Copying
Unlike traditional BI tools, MPP BI doesn't copy your data into a separate system or use a calculation engine. Instead, it connects directly to your database and runs all calculations right where your data already lives. This means you always see live data, no matter how large your dataset is. There are no size limits, no stale reports, and no expensive infrastructure to maintain the calculation layer.
Cloud and On-Premise Options
MPP BI is available both as a cloud solution and as an on-premise deployment. Companies can choose the option that fits their infrastructure and security needs.
With the on-premise version, you fully own and control your data on your own servers. With the cloud version, you can access your data easily without managing servers yourself.
More Affordable Alternative to Cognos
MPP BI offers two types of subscriptions: read-only users and admin users. The pricing differs for each type, which helps make the platform more affordable for customers.
Monthly subscription: $10/month for read-only users, $18/month for admin users
Perpetual license: $240 one-time for read-only users, $432 one-time for admin users (no annual fees)
Perpetual license: $240 one-time for read-only users, $432 one-time for admin users (no annual fees)
Compared to Cognos Premium ($42.40/user/month), MPP BI is up to 76% more affordable for read-only users and 58% more affordable for admin users. Enterprise Cognos plans can cost $70+/user/month, making the savings even greater.
Ask Questions in Plain English
You don't need to learn complicated tools to build reports. Just type what you want to know in normal language, and MPP BI creates the dashboard or report for you. For example, type "Show me sales by region this quarter" and the platform builds it automatically.
Perpetual License
MPP BI also offers a perpetual license for both read-only and admin users. This option is designed for customers who want to avoid annual subscription costs, and it can be more cost-effective in the long term.
Modern and Flexible
MPP BI has a modern and easy-to-use interface that can be customized to fit your company’s needs. It works well with other tools and systems that your company uses. This is also an ideal solution for companies that have growing amounts of data, because it is fast and scalable.
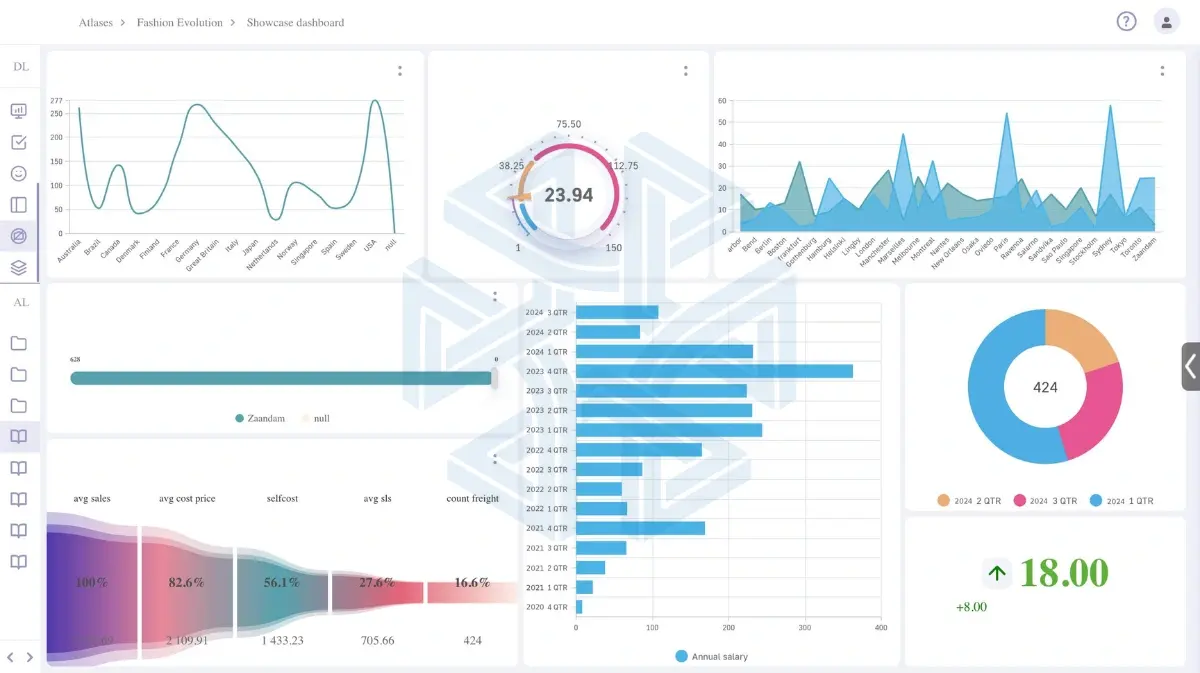
Customizable Visuals
The BI platform for reporting and analytics is interactive and customizable. Even non-technical users can explore it and quickly understand how the interface works.
We also offer the option to use your company’s brand colors and logo in the interface, because we believe every company should have a system that reflects its own identity and feels familiar to its team.
MPP BI vs. Cognos: Direct Comparison
How Does MPP BI Reporting Work?
But where does this data come from, and how does it get prepared for reporting? This is where MPP ETL comes in as part of the platform. As the name suggests, it Extracts, Transforms, and Loads the data so MPP BI can use it for analysis and dashboards.
1. Connect to Data
MPP ETL works with different kinds of data such as sales numbers, inventory and records. The data is usually stored in systems or databases, so MPP ETL reads it from where it lives.
One feature that makes MPP BI stand out is that it can work with many different data sources. It is flexible and can connect directly to databases using JDBC (Java Database Connectivity), or connect to other systems through APIs.
2. Model the Data
Before reporting starts, someone needs to set up a data model. We make this easy by letting users drag and drop files in a user-friendly interface. Basically, this is a way to tell the system what data exists and how different parts relate to each other.
3. Create Customizable Reports
Users can generate instant reports in different formats that shows:
- Lists of numbers (like Excel tables)
- Summaries (like total sales per month)
- Graphs and charts (like bar charts or pie charts)
The format of the generated reports is flexible based on your company’s needs. You can export them as Excel, PDF, Word documents, or even presentations in a matter of seconds.
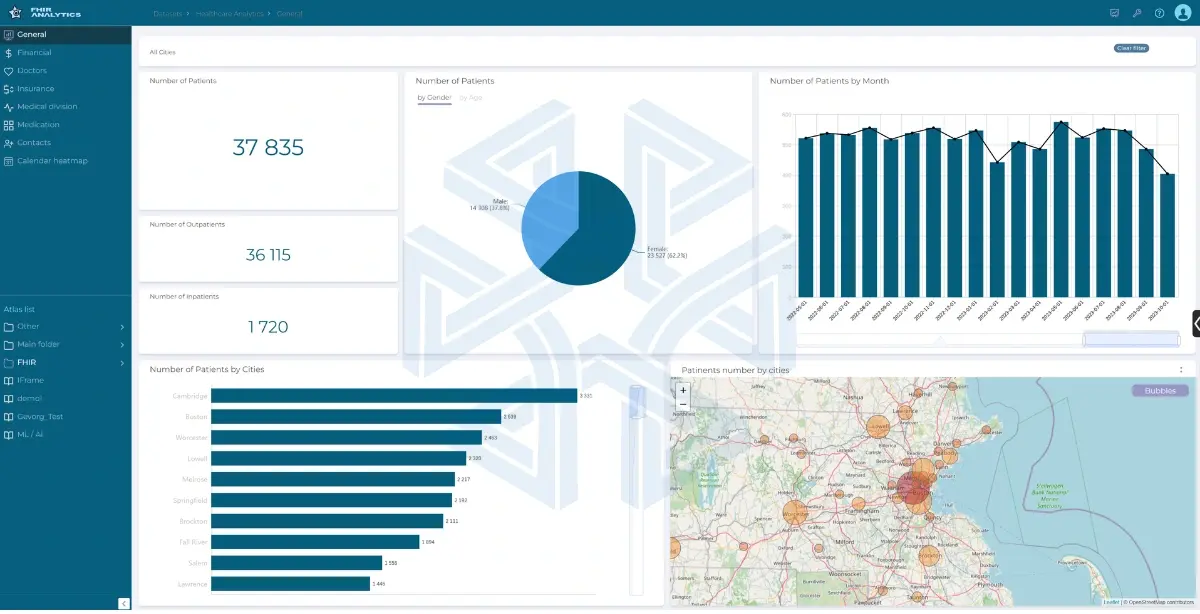
4. Data Visualization
Now you have clean data from different sources, ready to analyze. MPP BI helps you make this analysis faster and more efficient. The data can be displayed in different formats, such as charts, maps, tables, and text-based analytics. This allows users to view insights at a glance and create analytical reports easily.
Why does this matter? As a decision-maker, you need insights right in front of you, so you can quickly review the information and make informed decisions.
Retail Case Study Example
A retail company had data coming from three sources:
- Store sales
- Online orders
- Warehouse inventory
We used MPP ETL to collect the data, clean it, and prepare it for reporting. With MPP BI, the sales manager opens the dashboard, and on the screen sees:
- A chart showing total sales this month
- A table listing the top-selling products
- A map showing which cities have the highest sales
- A simple number showing how much inventory is left
Instead of opening different systems or asking IT for reports, the manager can see everything in one place and make decisions quickly. For example, if one product is selling fast but inventory is low, they can reorder it immediately.
This is the same level of reporting many companies expect from Cognos, but at a lower cost and with more flexibility.
Why Choose Our Platform Over Cognos
For businesses looking for a modern and affordable Cognos alternative, MPP BI is worth considering. It gives you the same kind of reporting and dashboards, but faster, at lower cost, and with an easy-to-use interface.
We are a data engineering and AI/ML consulting firm based in Richmond, Virginia. We recommend a free consultation call to talk about your needs and show you sample reports so you can see how MPP BI works in practice.